|
|
 |  | 
| Print
this Brief |
| How will climate change affect the regions
transportation system? |
| |
Key Points
Climate change places the tri-state metropolitan
area’s low-lying transportation infrastructure
at increased risk of flooding. This includes bridge
and tunnel access roads, subway stations, tunnels,
highways, and New York City’s airports. In
addition to the risk of storm flooding, some coastal
transportation facilities may be at risk of inundation
as the sea level rises.
The Transportation System
Four out of five boroughs
of New York City are located on islands. The bridges
and tunnels that connect the five boroughs are critical
bottlenecks along the main transportation paths to
the suburbs and counties located in the region. The
vast majority the region’s transportation infrastructure
was built during the period between the 1920s and
the 1970s as part of the construction of an integrated
Greater New York and the emergence of extensive suburban
development.
Today, with about 20 million people living, working
and commuting in its 31 counties, the New York metropolitan region is home to the largest public transportation
system in the United States. Many organizations are
part of this system: the Metropolitan Transportation
Authority (MTA), New Jersey Transit (NJT), and the
 |
| Figure
1. La Guardia Airport, Queens, NY. November
25,
1950. Source:
NYC Office of Emergency Management. |
|
|
Port Authority of New York and New Jersey (PANYNJ),
to name a few. These important components of the
region’s transport system provide and maintain
a large-scale public service. For example, MTA operates
subways, buses, and railroads that move 5.7 million
riders a day or 1.7 billion in a year. The MTA’s
bridges and tunnels carry upwards of a quarter of
a billion vehicles annually, more than any other
bridge and tunnel authority in the nation.
Sea-Level Rise and Flooding
Sea-level rise is projected
to cause an increase in flooding events, to which
the region’s low-lying transportation infrastructure
is vulnerable. In recent decades, the region has
been hit by severe Nor’easters. Two examples
are November 24 – 25, 1950 and December 11,
1992, with lesser events at other times. These Nor’easters
flooded airports and roadways (Figures 1 and 2).
The 1992 storm caused flooding at the Hoboken, New
 |
| Figure
2. Lower East Side, Manhattan. November 24,
1950. Source:
NYC Office of Emergency Management. |
|
|
Jersey PATH Station, interrupting commuter service
between New Jersey and New York City for 10 days
and service on other sections for two days while
equipment was repaired. Following this storm, floodgates
were installed at the top of stairways leading to
station platforms. In addition, design of any new
openings to the platform levels must now account
for current flood elevations.
Many elements of the
transportation and other essential infrastructure systems in the
New York metropolitan
region are located at elevations two to six feet
above current sea level. Storms frequently produce
flood
waters that exceed six feet. The shaded region in
Figure 3 displays the water level in the event of
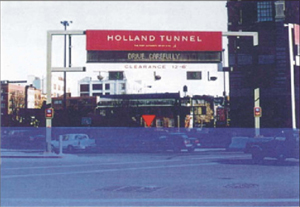 |
Figure
3. Potential Category 2 hurricane
surge on the Saffir-Simpson (SS)
Hurricane Scale at Holland Tunnel,
Manhattan entrance.Source:
NYC Office of Emergency Management.
|
|
|
a category
2 hurricane, indicating that the Holland Tunnel would
be inundated.
Bridge
access roads, entrances to road and rail tunnels,
and many transportation facilities are put in jeopardy
by flooding, including all three of the major
New York metropolitan region airports (La Guardia,
JFK, and Newark-Liberty), the Holland Tunnel and
Lincoln
Tunnel, the Passenger Ship Terminal, and major
arteries like the FDR Drive, the Brooklyn Belt
Parkway, and
the New Jersey Turnpike as it crosses the Hackensack
Meadowlands. Projections have been made about the
height of future flood waters which indicate that
at the least
some transportation facilities could be under
6 to 16 feet of water (Figure 4).
 |
Figure
4. Comparison of lowest critical
facility elevation with surge heights
for three reference periods: 5, 10,
and 500 years (from left to right)
and at the beginning (baseline) and
end (2090) of the twenty-first century.Source:
Jacob et al, Infrastructure, in Climate
Change and a Global City.
|
|
|
|
References:
Jacob, K.H., N. Edelblum, and J. Arnold (2001) Infrastructure.
In Rosenzweig, C. and W.D. Solecki, (eds.), "Climate
Change and a Global City: An Assessment of the Metropolitan
East Coast Region" (pp. 21 – 46) Columbia
Earth Institute, New York, 210 pp.
Rosenzweig, C. and W.D. Solecki (Eds.). 2001. "Climate
Change and a Global City: The
Potential Consequences of Climate Variability and Change – Metro
East Coast (MEC)." Report for the U.S. Global Change
Research Program, National Assessment of the Potential
Consequences of Climate Variability and Change for
the United States, Columbia Earth Institute, New York.
224 pp.
Related Resources:
Print version (factsheet pdf)
|
|
|
 |
| |
|
|
| |
|
|
|
File last modified: 29 March 2005 |
|
|
For more information about CIESIN and our activities contact CIESIN User Services
Telephone: 1 (845) 365-8988 - FAX:
1 (845) 365-8922
CIESIN is
a center within the Earth
Institute at Columbia University Copyright© 2004-2005. The Trustees of Columbia University in the City of New York.
|
 |
|
| |
|
|
|