|
|
 |  | 
| Print this Brief |
| What
changes in climate are projected for the region? |
| |
Key Points
A warming trend has been observed since 1900 in
the New York metropolitan area. Global climate models
(GCMs) project that the rate and amount of warming,
as well as the frequency and severity of extreme
events such as heat waves and droughts, will increase
over the twenty-first century. In addition, sea-level
rise would lead to more damaging coastal floods,
salinization of aquifers, loss of coastal land, and
other effects.
Current Trends
Over the past 100 years, temperature in the New
York metropolitan region has warmed nearly 2°F
(~1°C) (Table 1). This warming trend is based
on an average of data collected at 23 weather stations
in New York, New Jersey, and Connecticut. The regional
warming trend is greater than the rise of about 0.7°F
(~0.4°C) observed for the nation as a whole,
and it is also greater than the rise in global near-surface
air temperature of about 1.1°F (0.6°C). Precipitation
has also increased slightly over the past century
with a tendency towards increased extremes.
| |
Historical
Data
|
GCM
Projections
|
|
1900 1997
|
2020s
|
2050s
|
2080s
|
|
Rise in Mean
Temperature
|
+2°F
|
1.7 3.5°F
|
2.6 6.5°F
|
4.4 10.2°F
|
|
+1.1°C
|
0.9 1.9°C
|
1.4 3.6°C
|
2.4 5.7°C
|
|
Precipitation
Change
|
+1
inch
|
+1 9%
|
-16 +14%
|
-2 +30%
|
|
+2.54
cm
|
|
Sea Level Rise
|
+0.09 0.15
inches
|
4.3 11.7
in
|
6.9 23.7
in
|
9.5 42.5
in
|
|
+0.23 0.38
cm
|
10.9 29.7
cm
|
17.5 60.2
cm
|
24.1 108.0
cm
|
|
Heat Waves (days/year)
|
14
per year*
|
24 40
|
30 62
|
40 89
|
|
| Table 1. Climate change
in the New York metropolitan region. Based on
data in Rosenzweig and Solecki, eds., Climate Change
and a Global City, 2001. |
| |
 |
| |
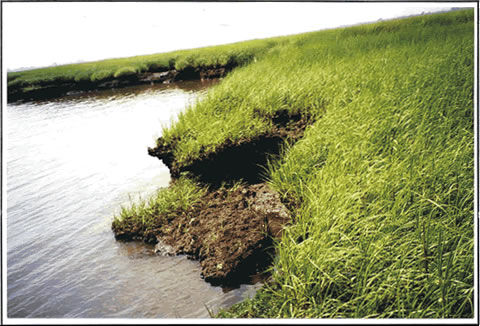
Figure
1. Rising sea level is contributing to the
erosion of wetlands. Source: Hartig et al,
Wetlands, in Climate Change and a Global City,
2001. |
Sea level has been rising along the East Coast of
the United States since the end of the last glaciation.
The rise in the twentieth century can be attributed
to both natural and anthropogenic (human-driven)
factors. About half the observed rise is related
to ongoing geologic subsidence following the end of the last glacial
period and about half is related to the warming trend
of the twentieth century. This warming trend has
caused thermal expansion of the upper oceans and
has also led to the melting of mountain glaciers,
both of which contribute to observed sea-level rise.
At present, the rate of relative sea-level rise in
New York City is 0.11 inches/year (2.73 millimeters/year)
(Figure 1). Sea level in the New York metropolitan
region is rising more quickly than global sea level,
probably due to ongoing regional subsidence. Future
sea-level rise would lead to more damaging coastal
floods.
Temperature and Precipitation
Projections
Global climate models (GCMs) project that the rate
and amount of temperature rise in the region will
increase over the twenty-first century due to anthropogenic
greenhouse warming (Table 1). Regional warming is
projected to occur in all seasons. Recent downscaled
projections with a regional climate model are shown
in Figure 2. Regional summertime temperatures are
projected to rise 2.12 – 2.75°C by the
2050s. The GCMs do not agree in the magnitude and
direction of precipitation changes. Overall, there
is substantial potential that gradual changes could
be punctuated by increases in extreme events such
as floods and droughts.
 |
| Figure 2.Sea-level
rise, measured at the Battery in New York
City, 1920 - 1997. Source:
Gornitz, NASA Goddard Institute for Space
Studies (NASA GISS) Climate Impacts Group,
2001. |
|
|
Sea-Level Rise Projections
With projected climate change, sea level in the
region may rise 4.3 – 11.7 inches by the 2020s,
6.9 – 23.7 inches by the 2050s, and 9.5 – 42.5
inches by the 2080s. Future sea-level rise would
lead to more damaging storm floods and a marked reduction
in the flood return period in coastal areas (Figure
3). The 100-year flood would have a probability of
occurrence, on average, once in 80 to 43 years in
the metropolitan area by the 2020s, once in 68 to
19 years by the 2050s, and once in 60 to as often
as every 4 years by the 2080s.
 |
| Figure
3. Reduction in 100-year flood return
period due to sea level rise. Source: Gornitz,
Sea Level Rise and Coasts, in Climate Change
and a Global City, 2001. |
|
Extreme Events
The New York metropolitan region periodically experiences
heat waves, floods, and moderate droughts. Global
climate change may increase the frequency, severity
and/or duration of these extreme weather events,
which could negatively affect the economic stability
of the region as well as individual health and safety.
Recent heat waves, droughts, and floods can serve
as examples for what we can expect to experience
in the future.
Heat waves
The summer of 1999 was punctuated by a series of
heat waves that imposed heat stress and extra energy
demands throughout the New York metropolitan area.
High temperatures were widespread in most of the
eastern portion of the nation in July. It can be
expected that heat waves, like the ones experienced
in 1999, will become more frequent in the tri-state
region as temperatures rise.
Droughts
Accompanying the summer heat in 1999 was a major
drought that affected most of the Northeast. It was
the worst drought in the United States since the
Dust Bowl droughts of the 1930s. In some parts of
the metropolitan region, there was no measurable
rain for more than two months. It was the driest
and warmest July on record. In the future, as the
frequency of heat waves increases, it can be expected
that there will also be an increase in droughts.
Scientists use the Palmer Drought Severity Index
(PDSI) to compare anomalous dry and wet years to
normal years and to identify relative droughts and
floods at particular places. The PDSI suggests that
climate change will bring more droughts to the region
(Figure 4).
 |
| Figure
4. Projected change in the Palmer Drought
Severity Index for New York City. Positive values
indicate an increase in the frequency of floods
and negative values indicate an increase in the
frequency of droughts. Source: Major and Goldberg,
Water Supply, in Climate Change and a Global
City, 2001. |
Floods
At the end of August 1999 after months of drought,
there was a heavy rainstorm. Between 2.5 and 6.1
inches (6.4 and 15.5 cm) fell in flash floods that
crippled the region’s mass transport system
the following morning. Up to 5 feet (1.5 meters)
of water covered the power tracks in various parts
of the New York City subways, stopping service and
stranding passengers on numerous lines. Like heat
waves and droughts, floods are expected to increase
in size and frequency as the climate changes.
References:
Flato, G.M., G.J. Boer, W.G. Lee, N.A. McFarlane, D. Ramsden, M.C. Reader, and
A.J. Weaver. 1997. The Canadian Centre for Climate Modeling and Analysis global
coupled model and its climate. The Canadian Centre for Climate Modeling and Analysis.
Atmospheric Environment Service. University of Victoria, BC.
IPCC (WGI). 1996. "Climate Change 1995: The Science of Climate Change: Contribution
of Working Group I to the Second Assessment Report of the Intergovernmental
Panel on Climate Change". J.T. Houghton, L.G. Meira-Filho, B.A. Callander,
N. Harris, A. Kattenberg, K. Maskell, eds. Cambridge University Press,
Cambridge.
Johns, T.E., R.E. Carnell, J.F. Crossley, J.M. Gregory, J.F.B. Mitchell, C.A.
Senior, S.F.B. Tett, and R.A. Wood. 1997. "The second Hadley Centre coupled
ocean-atmosphere GCM: Model description, spinup, and validation". Climate
Dynamics 13:103-134.
Karl, T.R., R.W. Knight, D.R. Easterling, and R.G. Quayle. 1996. "Indices
of climate change for the United States". Bulletin of the American
Meteorological Society 77(2): 279-292.
Rosenzweig, C. and W.D. Solecki (Eds.). 2001. Climate Change and a Global
City: The Potential Consequences of Climate Variability and Change - Metro
East Coast (MEC). Report for the U.S. Global Change Research Program, National
Assessment of the Potential Consequences of Climate Variability and Change
for the United States, Columbia Earth Institute, New York. 224 pp.
Related Resources:
Print version (factsheet pdf) |
| |
|
|
 |